Flourish | Create professional-grade visuals in minutes
Flourish
Introduction
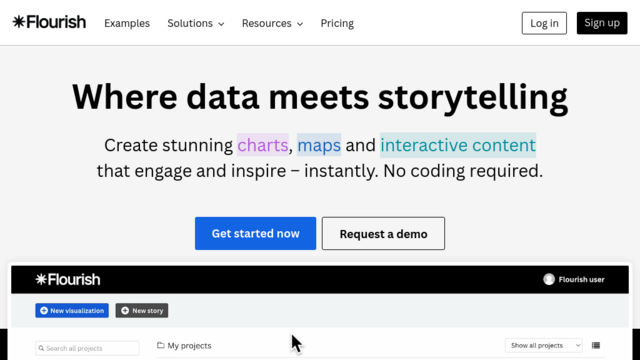
Flourish is a powerful data visualization platform that enables users to create interactive and engaging visual representations of data without the need for coding. It offers a wide array of templates and tools designed to transform complex datasets into compelling stories, making data accessible and understandable for diverse audiences.
Use Cases
Data Storytelling
Craft interactive narratives by combining various visualizations to present data-driven stories effectively.
Business Reporting
Enhance reports with dynamic charts and graphs, providing clear insights for stakeholders.
Educational Content
Develop engaging educational materials that simplify complex concepts through visual aids.
Journalism
Create compelling visual stories to accompany articles, enriching the reader’s experience.
Marketing Campaigns
Design interactive visuals to showcase campaign performance and market trends.
Features & Benefits
Extensive Template Library
Access a diverse range of customizable templates, including bar charts, line graphs, maps, and more.
No-Code Interface
Easily create sophisticated visualizations without any programming knowledge.
Interactive Storytelling
Combine multiple visualizations into cohesive stories that engage and inform audiences.
Seamless Embedding
Integrate visualizations into websites, presentations, and social media platforms effortlessly.
Collaborative Tools
Work collaboratively with team members, ensuring consistency and efficiency in projects.