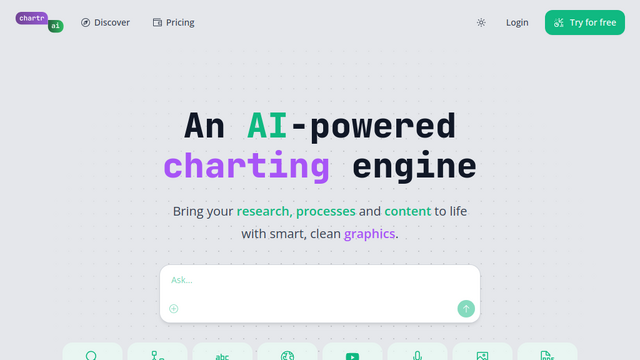
Chartr is an AI-powered visualization platform and charting engine designed to transform unstructured information—such as text, URLs, and YouTube videos—into structured diagrams and charts. It acts as a visual workspace where users can add sources and use natural language to generate flowcharts, timelines, and data visualizations. By combining AI reasoning with specialized ‘Chartrs’ (agents), it helps users bring research, processes, and content to life without manual design work.
Use Cases
Video Summarization
Convert YouTube video links into interactive timelines and visual overviews with playable timestamps.
Process Mapping
Instantly generate flowcharts and sequence diagrams from written project descriptions or SOPs.
Research Organization
Extract and organize media mentions (books, articles, movies) from podcast episodes or long-form articles.
Business Analysis
Use specialized agents to build complex models like a BCG matrix or a 2×2 personality analyzer from chat threads.
Creative Brainstorming
Quickly spin up mind maps and state diagrams to visualize software workflows or creative projects.
Features & Benefits
Diverse Chart Library
Supports a wide range of formats including Flowcharts, Sankey diagrams, Sequence diagrams, Mind Maps, 2×2 matrices, and standard Bar/Pie charts.
AI-Powered Search
Integrated web and YouTube search capabilities that allow the AI to fetch external data to populate charts.
Customized Agents (‘Chartrs’)
A marketplace of specialized AI agents tailored for specific tasks like TV show formula visualization or Spanish language learning.
Multi-Format Export
Allows users to export visualizations as high-quality images, raw text, or Mermaid.js code for use in documentation.
URL Shortcut
A productivity feature where users can simply prepend ‘chartr.ai/’ to any URL in their browser to begin analyzing that page.