CanvasXpress | JavaScript library for data analytics
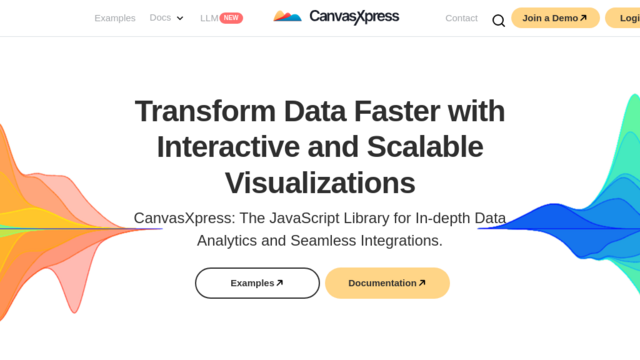
CanvasXpress
Introduction
CanvasXpress is a powerful open-source JavaScript library built for creating a wide variety of interactive data visualizations. Leveraging HTML5 Canvas, it offers extensive plot types, particularly excelling in scientific data analysis, bioinformatics, and complex statistical charts, allowing for dynamic exploration and highly customizable outputs.
Use Cases
Scientific Data Visualization
For researchers and scientists to visualize complex biological data such as genomics, proteomics, and other ‘omics’ data.
Business Intelligence Dashboards
Developers can integrate CanvasXpress into business intelligence tools to create interactive financial, sales, and operational dashboards.
Educational & Research Platforms
Building interactive modules for teaching statistics, data science, or bioinformatics, allowing students to explore datasets dynamically.
Web Application Development
Embedding advanced, high-performance data visualization capabilities into web-based analytical and reporting applications.
Publication-Quality Figures
Generating highly customizable and aesthetically pleasing charts and graphs suitable for academic papers, presentations, and reports.
Features & Benefits
Extensive Visualization Types
Offers over 50 plot types, from basic bar and line charts to complex heatmaps, genome browsers, and network diagrams, providing versatility for any data.
Highly Interactive Capabilities
Features like zooming, panning, brushing, filtering, and event handling allow for deep and dynamic exploration of data points directly within the visualization.
Advanced Customization Options
Provides granular control over chart aesthetics, including colors, labels, legends, annotations, and layouts, ensuring visualizations meet specific design and analytical needs.
Open Source & Free to Use
Licensed under the GNU Affero General Public License (AGPL) version 3, making it a cost-effective solution for both personal and commercial projects.
Efficient Canvas-Based Rendering
Utilizes HTML5 Canvas for rendering, which ensures high performance and scalability, particularly when dealing with large datasets and complex visualizations.
Comprehensive Library
Offers an exceptionally broad range of visualization types, covering almost any data visualization need.
Deep Interactivity
Enables users to deeply explore and manipulate data within the charts themselves.
Optimized for Scientific Data
Particularly robust for bioinformatics, genomics, and other scientific data analysis.
Open Source & No Cost
Completely free to use, fostering transparency and community contributions.
Cons
Steep Learning Curve
The extensive feature set and customization options can be overwhelming for new users.
Complex Documentation
While comprehensive, the sheer volume of information can make navigating the documentation challenging.
AGPLv3 License Considerations
The AGPLv3 license requires sharing source code of derivative works, which might be a limitation for some proprietary commercial applications.
JavaScript Dependency
Requires a good understanding of JavaScript for effective implementation and customization.